How to Identify Regular and Hidden Divergence
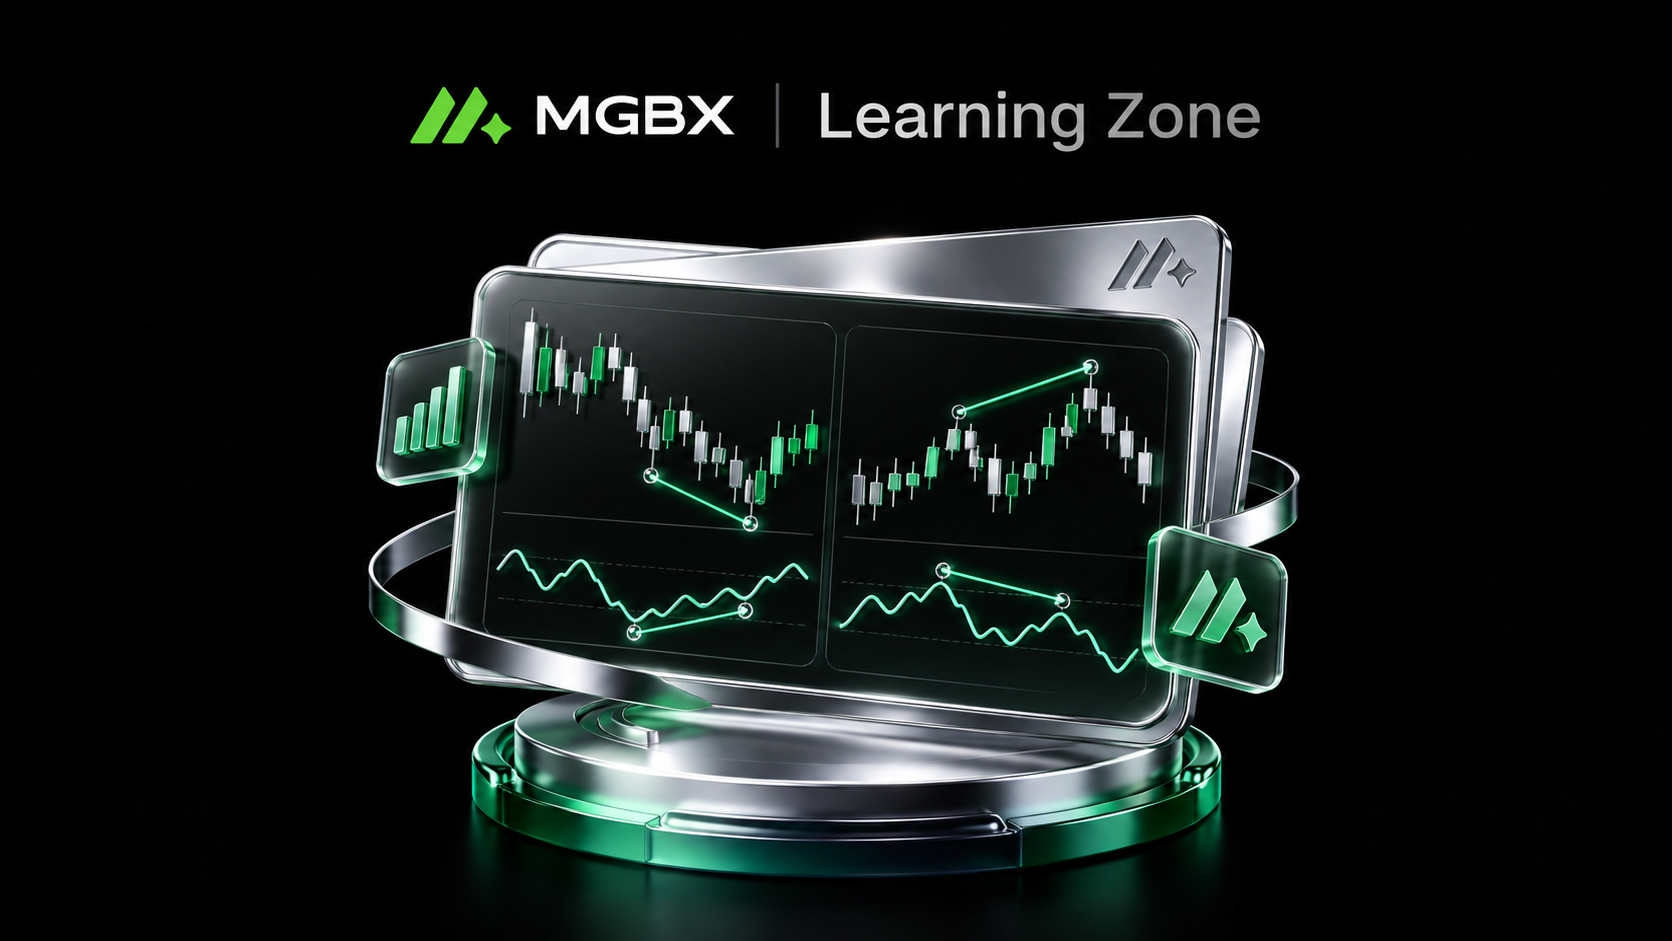
Bullish and bearish divergence occurs when price and a momentum indicator do not form corresponding highs or lows. Regular bullish divergence typically appears when price makes a lower low while the indicator forms a higher low. Regular bearish divergence occurs when price makes a higher high while the indicator forms a lower high. Hidden divergence is more commonly used to assess whether an existing trend may continue. Divergence can reveal differences between price action and momentum, but it cannot independently confirm that a trend will reverse or continue.
How Do Regular Bullish and Bearish Divergence Work?
Divergence refers to a lack of confirmation between price action and momentum indicators such as RSI, MACD, or Stochastic. Regular bullish divergence typically occurs when price forms a Lower Low while the indicator forms a Higher Low. This suggests that although price has moved to a new low, the downside momentum reflected by the indicator has not made a corresponding new low. Regular bearish divergence typically occurs when price forms a Higher High while the indicator forms a Lower High.
Schwab’s technical analysis materials use the same general structure to explain regular divergence and emphasize that divergence is better viewed as a potential warning of changing market conditions rather than a guarantee of a profitable outcome.
Hidden Divergence vs Regular Divergence
Hidden divergence is generally used to assess whether an existing trend may continue. Hidden bullish divergence occurs when price forms a Higher Low while the momentum indicator forms a Lower Low. This structure is commonly seen during a pullback within an uptrend. Hidden bearish divergence occurs when price forms a Lower High while the indicator forms a Higher High and is more commonly associated with a rebound within a downtrend.
According to Schwab, regular divergence is more closely associated with potential trend reversals, while hidden divergence is commonly used to assess possible trend continuation. However, both remain conditional technical signals and do not guarantee that the market will subsequently move in the expected direction.
How Can RSI and Price Structure Be Used to Confirm Divergence?
RSI is a widely used momentum oscillator that measures the speed and magnitude of price changes. Fidelity’s technical indicator guide notes that RSI traditionally ranges from 0 to 100 and can be used alongside divergence to evaluate changes in market momentum. It also notes that RSI can remain overbought or oversold for extended periods during strong trends.
A more structured way to use divergence is to first identify two comparable price highs or lows, then check whether RSI, MACD, or another momentum indicator forms a different structure. Traders may then consider support and resistance, market structure, and volume for additional context. In strong directional markets, divergence can appear repeatedly while price continues in the same trend, so it is better treated as a reason for further analysis rather than as a standalone entry or reversal signal.
FAQ
-
What is regular bullish divergence?
It typically occurs when price forms a lower low while RSI, MACD, or another momentum indicator forms a higher low. This indicates that price and downside momentum are not fully aligned. -
What is regular bearish divergence?
It generally occurs when price forms a higher high while the momentum indicator forms a lower high. This may indicate changing upside momentum but does not confirm that a market top has formed. -
What is the difference between hidden and regular divergence?
Regular divergence is more commonly used to assess potential reversals, while hidden divergence is more often used to evaluate whether an existing trend may continue. Their high-low structures are different. -
Which timeframe is most accurate for divergence?
There is no single best timeframe for every market or strategy. Different timeframes contain different levels of market noise and trading activity and should be matched to the analysis being used. -
Does RSI divergence mean price will definitely reverse?
No. Divergence only shows that price and momentum are not moving in sync. The market may consolidate or continue in the existing trend.
Mastering the basics is the first step. Follow MGBX Academy to access more cryptocurrency educational resources and market opportunities.
The process for trading on MGBX:
-
Register a trading account and complete the necessary identity verification;
-
Deposit funds and select a trade type;
-
On the cryptocurrency trading page, enter the amount or quantity of the cryptocurrency you wish to purchase;
-
Confirm the order to complete the trade, and check that your assets have increased accordingly.