Higher Highs and Lower Lows: How to Read Market Structure With HH, HL, LH, and LL
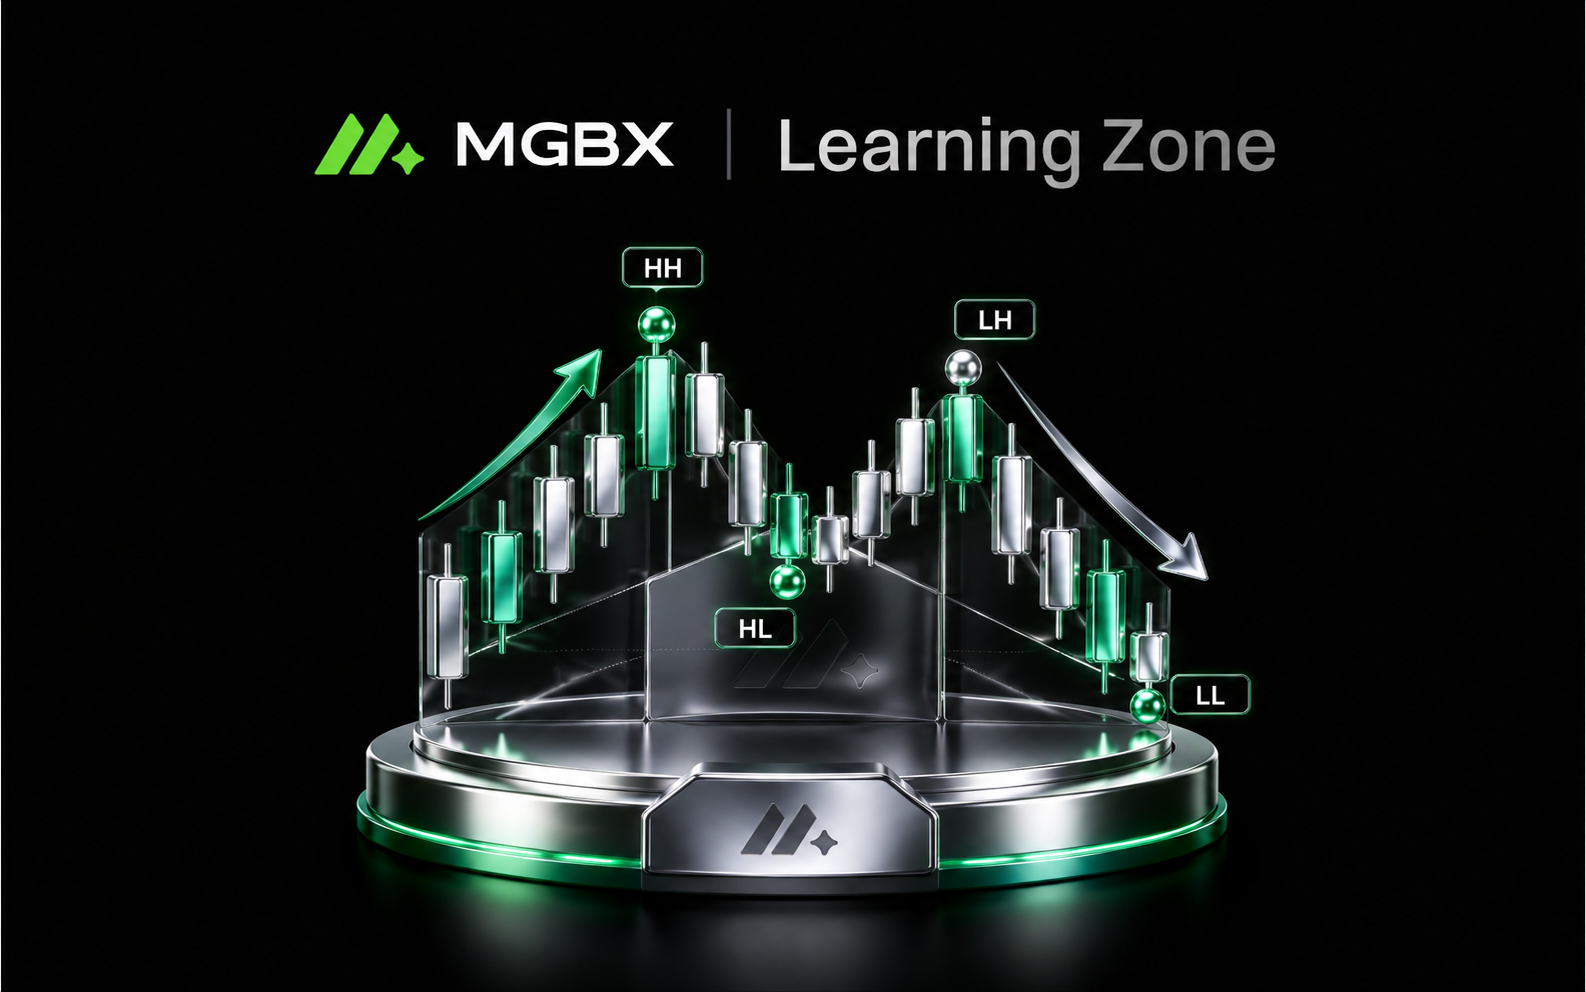
Higher High, Higher Low, Lower High, and Lower Low are fundamental concepts in price action and market structure analysis. An uptrend typically consists of a sequence of Higher Highs (HH) and Higher Lows (HL), while a downtrend generally forms Lower Highs (LH) and Lower Lows (LL). However, a single break above a swing high or below a swing low is not enough to confirm a trend reversal. What matters more is the relationship between consecutive highs and lows and whether a new structure develops after the break.
What Are HH, HL, LH, and LL?
Market prices typically move through a sequence of rallies, pullbacks, rebounds, and declines, creating swing highs and swing lows. A Higher High (HH) occurs when a significant new high exceeds the previous comparable high, while a Higher Low (HL) occurs when a new pullback low remains above the previous low. A Lower High (LH) forms when a rebound peaks below the previous high, while a Lower Low (LL) occurs when a new significant low falls below the previous low.
Fidelity’s trend analysis materials describe an uptrend as a sequence of rising peaks and troughs, corresponding to Higher Highs and Higher Lows. A downtrend is characterized by declining peaks and troughs, or Lower Highs and Lower Lows. For this reason, trend analysis should focus on a sequence of market swings rather than a single new high or low.
Does a Break in Market Structure Mean the Trend Has Reversed?
A change in market structure is worth monitoring, but it does not automatically mean that a full trend reversal has taken place. For example, if a market that has consistently formed HHs and HLs breaks below an important Higher Low for the first time, the previous bullish structure has weakened. Price may still recover, enter a trading range, or continue lower and eventually establish a new sequence of Lower Highs and Lower Lows.
Fidelity’s discussion of trendline breaks takes a similarly cautious approach. A break can serve as a warning that the trend may be changing, but it should not be treated as confirmation by itself and is generally considered alongside other analytical information.
What Are Support, Resistance, and False Breakouts?
Previous highs and lows are often used to identify potential support and resistance areas, but a break above a historical high does not guarantee that the same level will later become support. Likewise, a break below a previous low does not guarantee that it will become resistance. Price may briefly move beyond an important level before quickly returning to the previous range, a move commonly described as a False Breakout.
To reduce the risk of treating short-lived price moves as structural changes, traders may also examine where the candle closes, whether price continues after the breakout, trading volume, and the structure on higher timeframes. These additional factors can provide more context but cannot eliminate false breakouts or incorrect signals entirely. Market structure is therefore more useful as a consistent framework for analyzing price behavior than as a deterministic forecasting tool.
FAQ
-
What does Higher High mean?
A Higher High occurs when a significant new price high exceeds the previous comparable high. It is commonly associated with bullish market structure, but a single HH is not enough to confirm a full trend. -
What does Lower Low mean?
A Lower Low occurs when a significant new low falls below the previous low. It is commonly associated with bearish market structure but should still be evaluated alongside Lower Highs and other market swings. -
Does one Higher High confirm an uptrend?
Not necessarily. A more complete uptrend typically also includes Higher Lows and a sequence of rising highs and lows. -
Does breaking the previous Higher Low automatically turn the market bearish?
No. It signals a change in the existing structure, but subsequent formation of Lower Highs and Lower Lows provides more information about whether a bearish trend is developing. -
Which highs and lows matter most?
Traders generally focus on Swing Highs and Swing Lows that caused meaningful pullbacks or rebounds rather than minor fluctuations in individual candles.
Mastering the basics is the first step. Follow MGBX Academy to access more cryptocurrency educational resources and market opportunities.
The process for trading on MGBX:
-
Register a trading account and complete the necessary identity verification;
-
Deposit funds and select a trade type;
-
On the cryptocurrency trading page, enter the amount or quantity of the cryptocurrency you wish to purchase;
-
Confirm the order to complete the trade, and check that your assets have increased accordingly.